Phillipa English

Art Industry Data Visualisation

As part of a course at Uni, we were required to create a simple data visualisation.

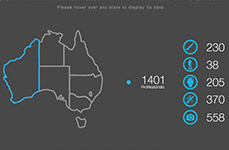
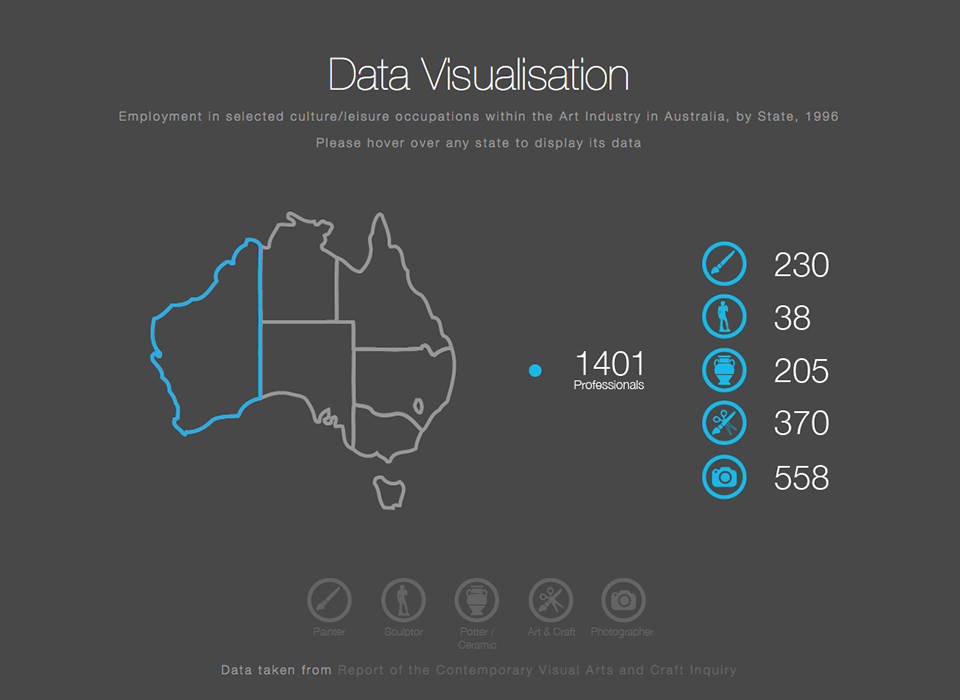
I sourced the data from the Report of the Contemporary Visual Arts and Craft Inquiry and created the data visualisation using HTML and CSS, along with easy to decipher graphics. As one of my first projects using HTML and CSS, the coding is basic but effective for its simple purpose.

To view and interact with the data visualisation, click here.

Horseland AW17 CatalogueHorseland AW17 Catalogue
The Pool RoomThe Pool Room Branding
Fire Sculpture
Hazara Refugees Report
Snow Sculpture
Groovin The Moo Website Design
Horseland AW17 CatalogueHorseland & New Zealand SS16 Catalogue
Tusmeem App Design
Australian Rainforest Honey Branding & Package Design
Art Industry Data Visualisation
Collegiate Saddle Training Guide
Collegiate POS Poster
Horseland Birthday POS & Digital
Horseland Easter POS & Digital
Hazara Refugee Cultural Guides